可观测性
请参考 ActivitySourceApi 、OpenTelemetryConsole 示例。
部署环境
为了快速部署可观测性平台,可以使用 OpenTelemetry 官方提供的示例包快速部署相关的服务,里面包含了 Prometheus、Grafana、Jaeger 等中间件。
open-telemetry 官方集成项目地址:https://github.com/open-telemetry/opentelemetry-demo
下载示例仓库源码:
git clone -b 1.12.0 https://github.com/open-telemetry/opentelemetry-demo.git
请注意,不要下载 main 分支,因为有可能带有 bug。
可以把版本号设置为最新的版本。
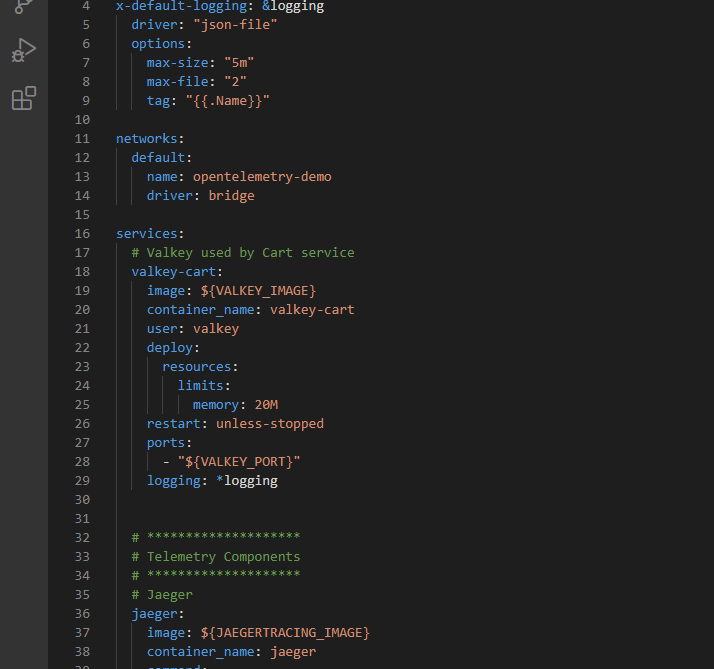
由于 docker-compose.yml 示例中会包含大量的 demo 微服务,我们只需要基础设施即可因此我们需要打开 docker-compose.yml 文件,将 services 节点的 Core Demo Services 和 Dependent Services 只保留 valkey-cart,其它直接删除。或者直接点击下载笔者已经修改好的版本替换到项目中: docker-compose.yml
注意,不同版本可能不一样。
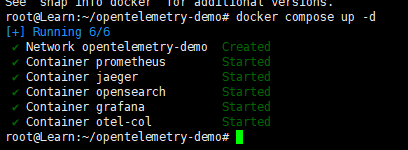
执行命令部署可观测性服务:
docker-compose up -d
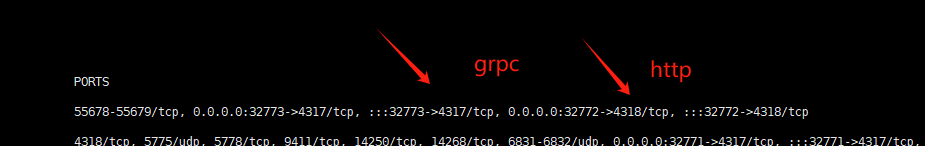
opentelemetry-collector-contrib 用于收集链路追踪的可观测性信息,有 grpc 和 http 两种,监听端口如下:
| Port | Protocol | Endpoint | Function |
|---|---|---|---|
| 4317 | gRPC | n/a | Accepts traces in OpenTelemetry OTLP format (Protobuf). |
| 4318 | HTTP | /v1/traces |
Accepts traces in OpenTelemetry OTLP format (Protobuf and JSON). |
经过容器端口映射后,对外端口可能不是 4317、4318 了。
引入 Maomi.MQ.Instrumentation 包,以及其它相关 OpenTelemetry 包。
<PackageReference Include="Maomi.MQ.Instrumentation " Version="1.1.0" />
<PackageReference Include="OpenTelemetry.Exporter.Console" Version="1.8.1" />
<PackageReference Include="OpenTelemetry.Exporter.OpenTelemetryProtocol" Version="1.8.1" />
<PackageReference Include="OpenTelemetry.Extensions.Hosting" Version="1.8.1" />
<PackageReference Include="OpenTelemetry.Instrumentation.AspNetCore" Version="1.8.1" />
引入命名空间:
using OpenTelemetry.Logs;
using OpenTelemetry.Metrics;
using OpenTelemetry.Resources;
using OpenTelemetry.Trace;
using Maomi.MQ;
using OpenTelemetry.Exporter;
using RabbitMQ.Client;
using System.Reflection;
using OpenTelemetry;
注入链路追踪和监控,自动上报到 Opentelemetry。
builder.Services.AddOpenTelemetry()
      .ConfigureResource(resource => resource.AddService(serviceName))
      .WithTracing(tracing =>
      {
          tracing.AddMaomiMQInstrumentation(options =>
          {
              options.Sources.AddRange(MaomiMQDiagnostic.Sources);
              options.RecordException = true;
          })
          .AddAspNetCoreInstrumentation()
          .AddOtlpExporter(options =>
          {
              options.Endpoint = new Uri(Environment.GetEnvironmentVariable("OTLPEndpoint")! + "/v1/traces");
              options.Protocol = OtlpExportProtocol.HttpProtobuf;
          });
      })
      .WithMetrics(metrices =>
      {
          metrices.AddAspNetCoreInstrumentation()
          .AddMaomiMQInstrumentation()
          .AddOtlpExporter(options =>
          {
              options.Endpoint = new Uri(Environment.GetEnvironmentVariable("OTLPEndpoint")! + "/v1/metrics");
              options.Protocol = OtlpExportProtocol.HttpProtobuf;
          });
      });
链路追踪
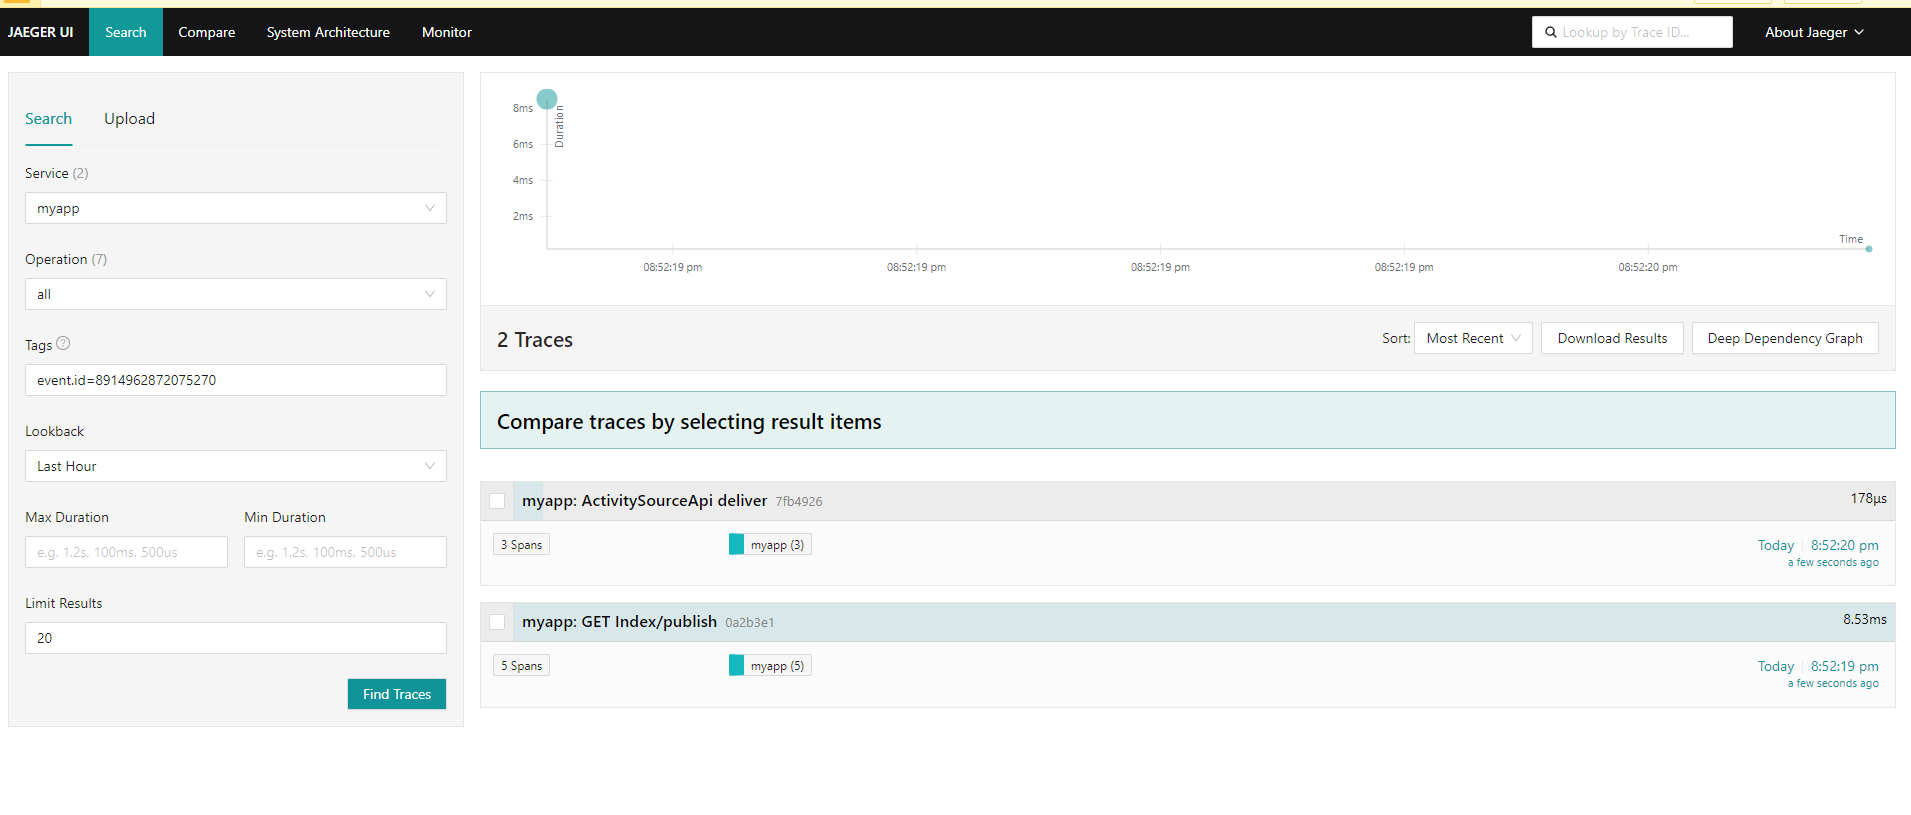
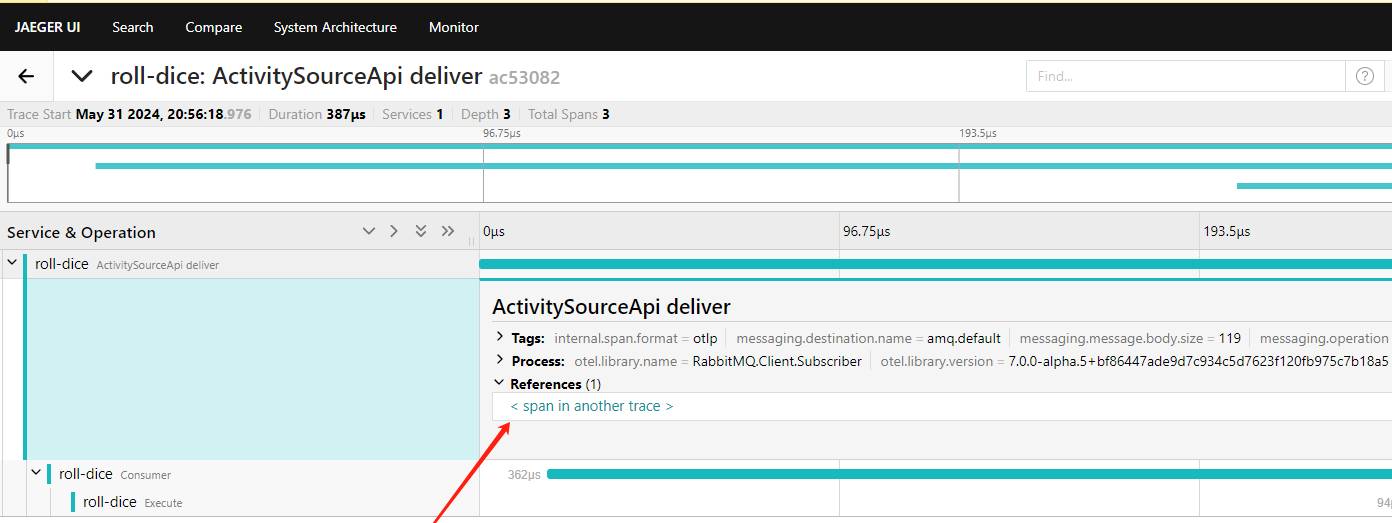
启动 ActivitySourceApi 服务后,进行发布、消费,链路追踪信息会被自动推送到 OpenTelemetry Collector 中,通过 Jaeger 、Skywalking 等组件可以读取出来。
打开映射了 16686 端口的 Jaejer ui 面板:
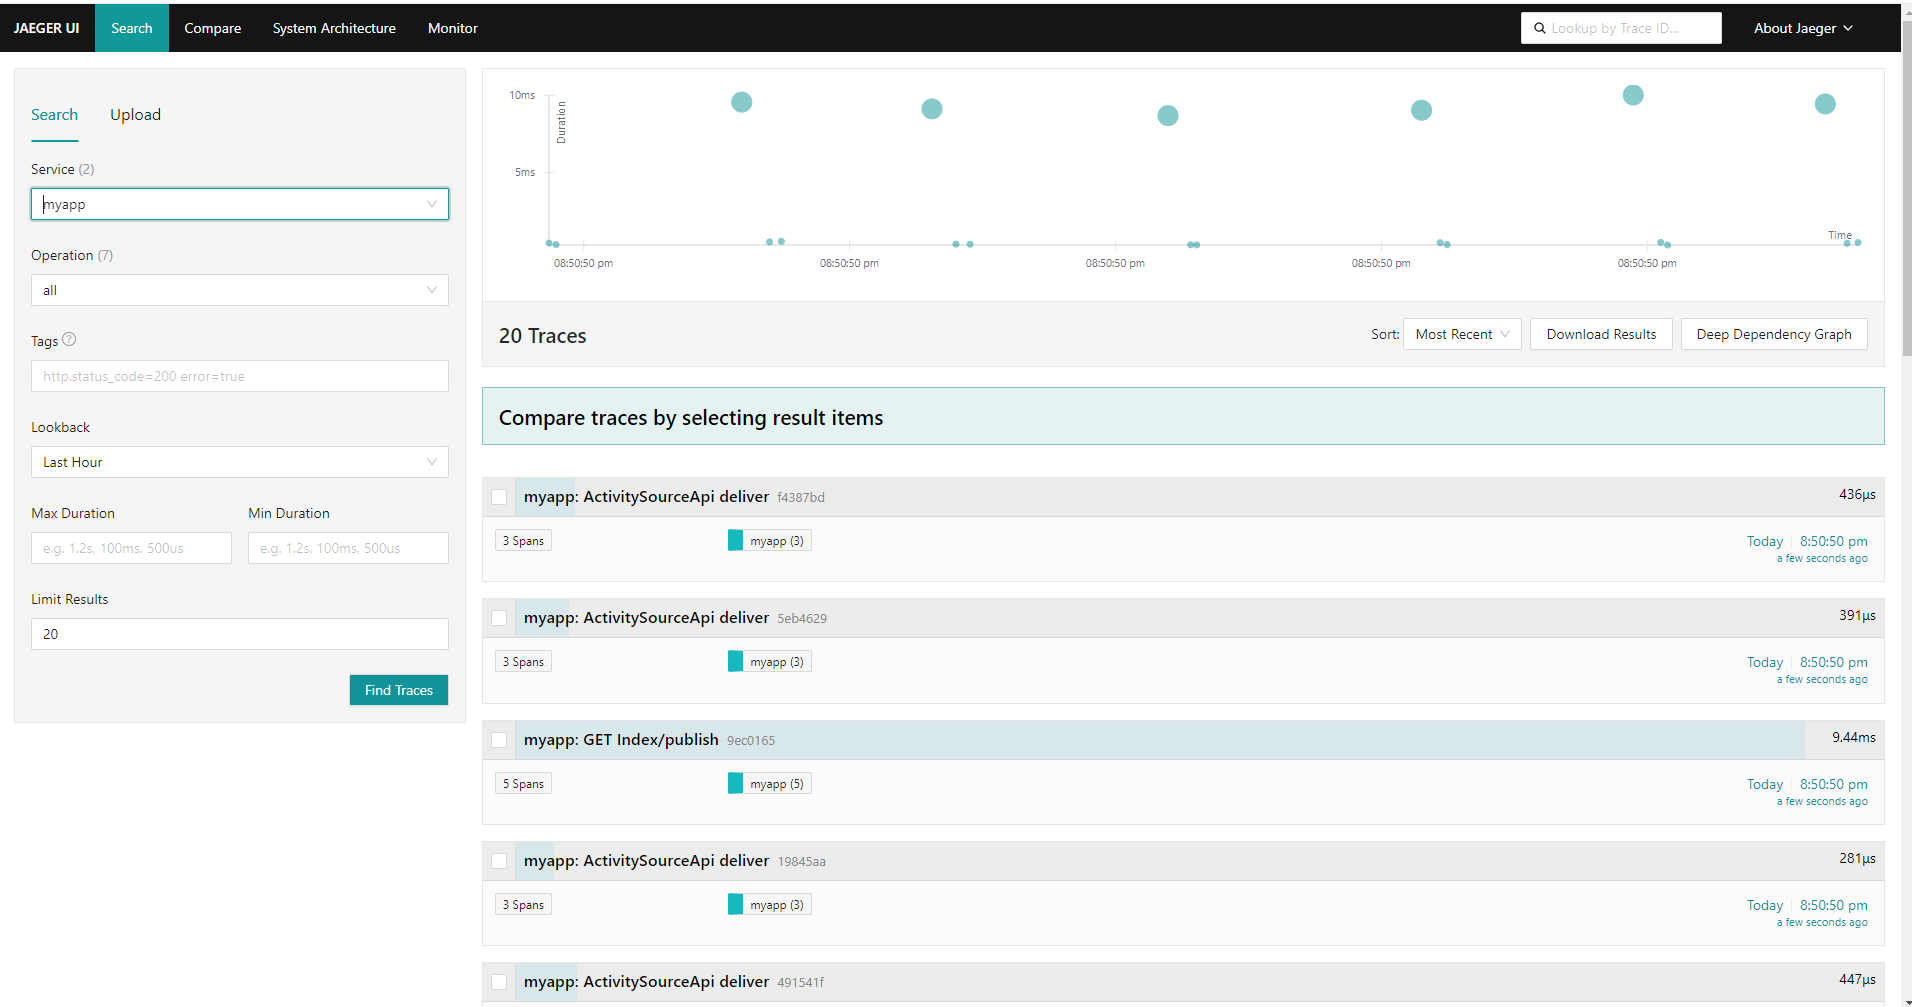
由于 publish、consumer 属于兄弟 trace 而不是同一个 trace,因此需要通过 Tags 查询相关联的 trace,格式 event.id=xxx。
监控
Maomi.MQ 内置了以下指标:
| 名称 | 说明 |
|---|---|
| maomimq_consumer_message_pull_count_total | 已拉取的消息条数 |
| maomimq_consumer_message_faild_count_total | 消费失败的消息数量 |
| maomimq_consumer_message_received_Byte_bucket | |
| maomimq_consumer_message_received_Byte_count | |
| maomimq_consumer_message_received_Byte_sum | 接收到的消息总字节数 |
| maomimq_publisher_message_count_total | 发送的消息数量 |
| maomimq_publisher_message_faild_count_total | 发送失败的消息数量 |
| maomimq_publisher_message_sent_Byte_bucket | |
| maomimq_publisher_message_sent_Byte_count | |
| maomimq_publisher_message_sent_Byte_sum | 发送的消息的总字节数 |
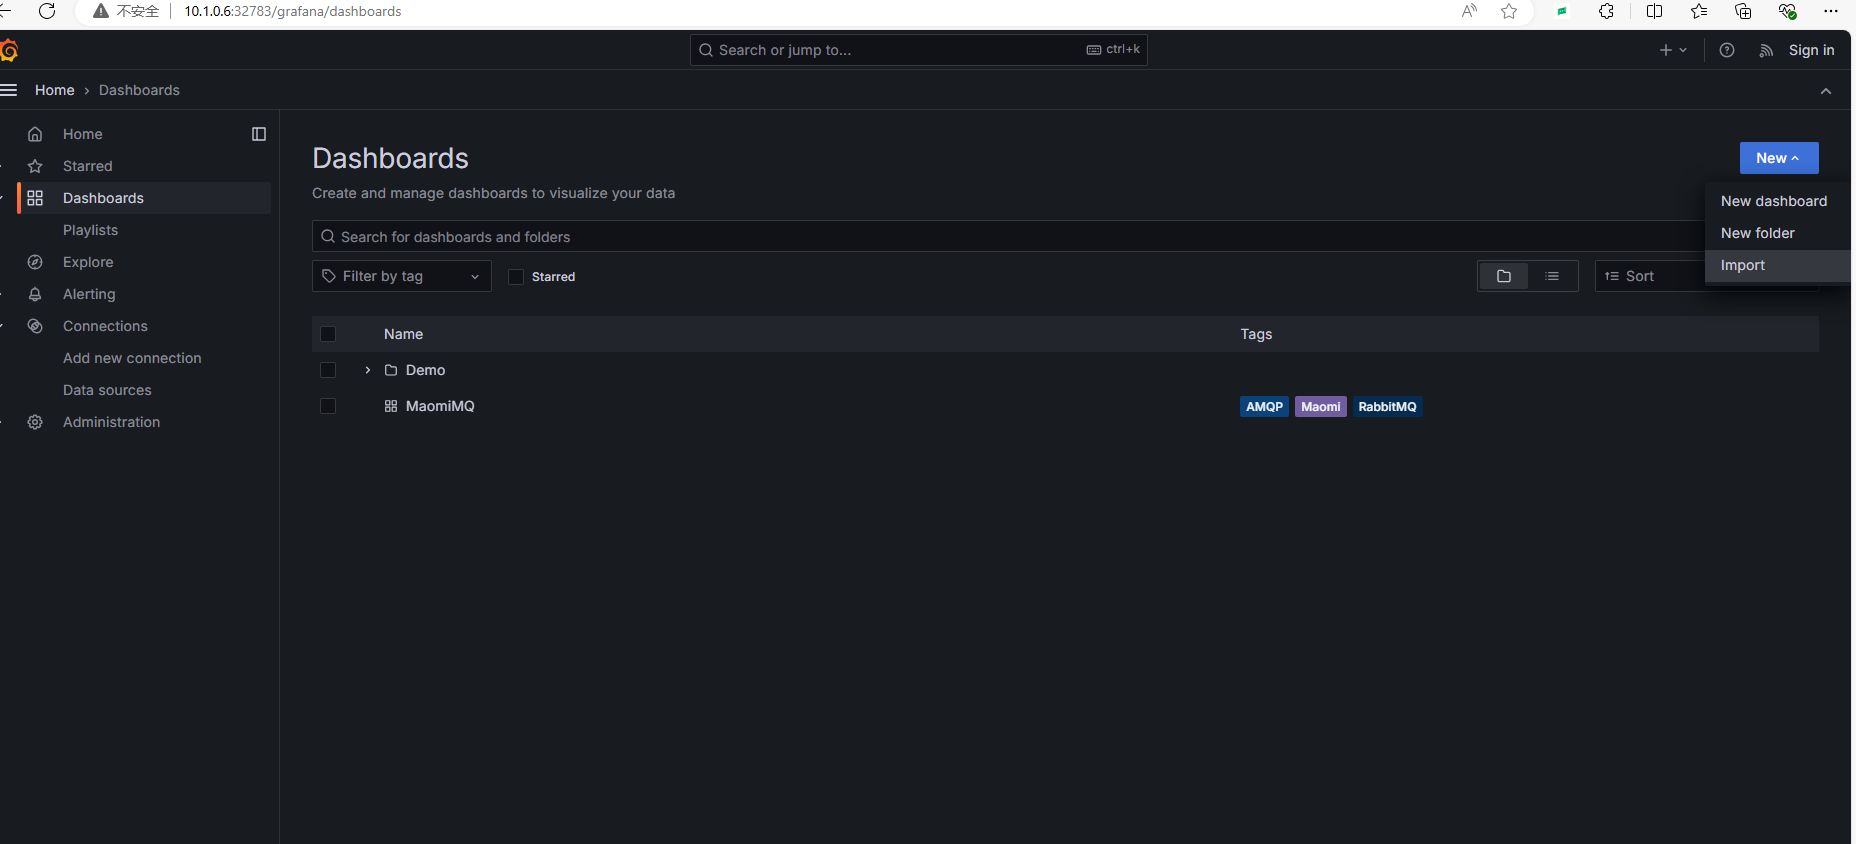
接着,要将数据显示到 Grafana 中。
下载模板文件: maomi.json
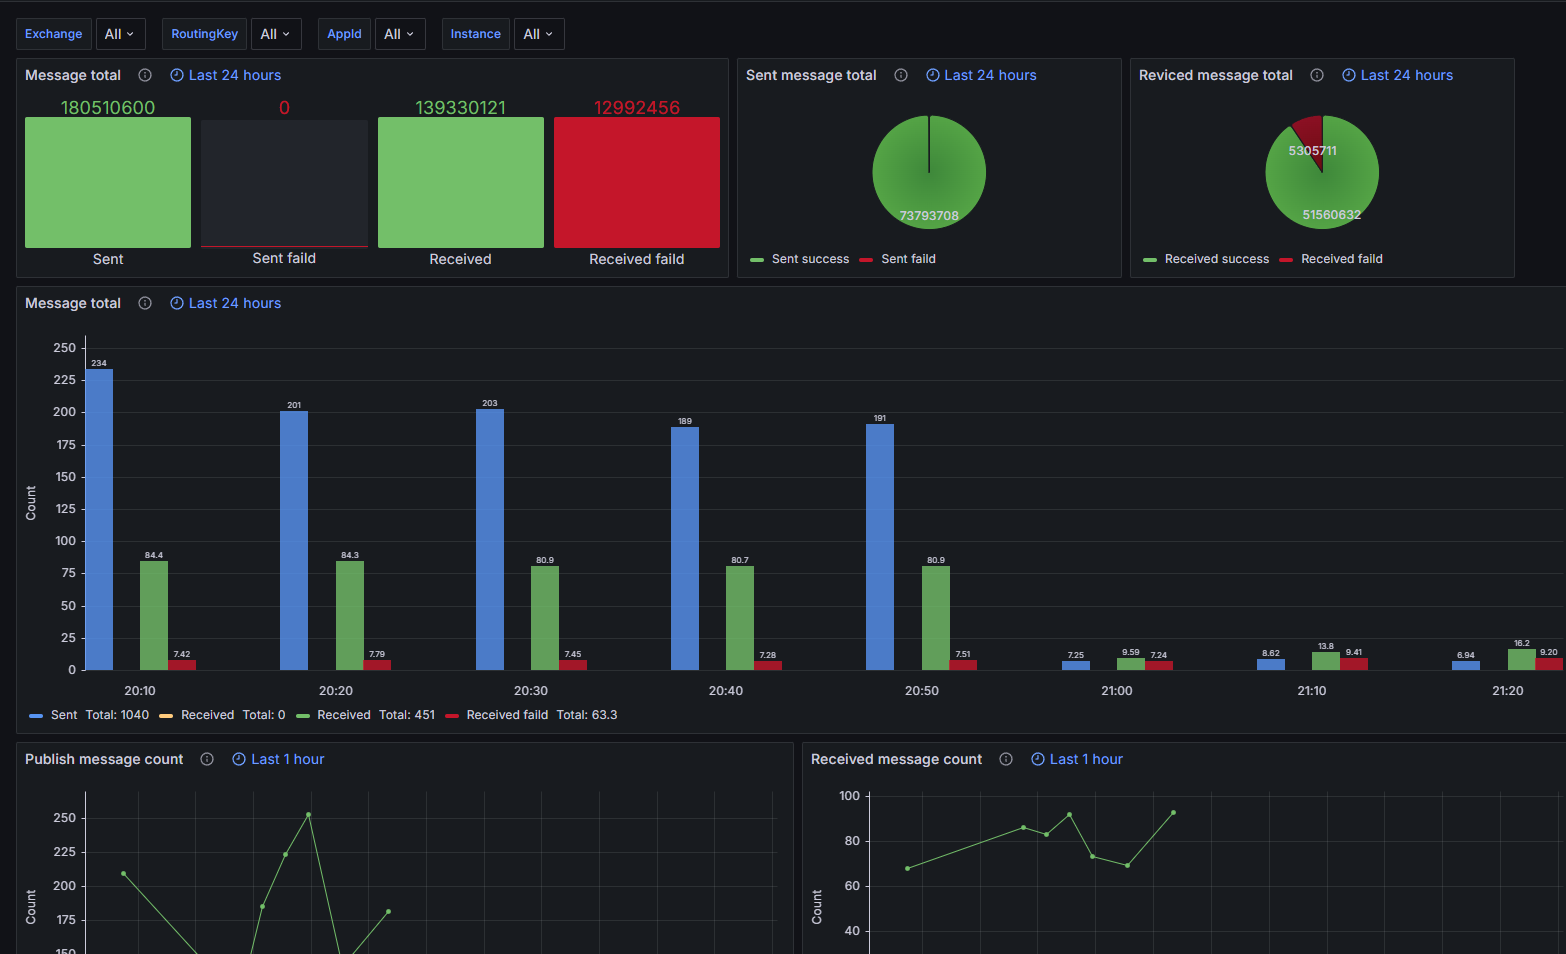
然后在 Grafana 面板的 Dashboards 中导入文件,可以在面板中查看当前所有服务的消息队列监控。
开源项目代码引用
OpenTelemetry.Instrumentation.MaomiMQ 项目的 Includes 代码来源于 https://github.com/open-telemetry/opentelemetry-dotnet-contrib/tree/main/src/Shared